First Mile Screening & EUDR Enforcement — User Guide
How to use each tab of the two applications, what each column and score shows, and which files you can export.
This guide covers two applications that share one engine: First Mile Screening, for a company screening its own supply base, and EUDR Enforcement, for an authority checking submitted statements. The scores, the bands and the reports are the same in both. What differs is the tabs, and which checks run. Sections 3 to 5 use the screening names; the table in section 2 gives the enforcement name of each tab.
- Discover, by Company. Use this tab if you do not know the first mile locations. Type a company name. The application finds the first mile supply of the company. It screens each location. It puts the locations in order of priority.
- Screen, by Supplier Location. Use this tab if you know the supplier locations. Give the locations to the application. The application does the same checks on these locations.
- Screen, by Plot Boundaries. Use this tab if you hold the plot boundaries of the producer. Send the polygons. The application screens each plot on its own area, and it gives one result for each plot.
Enforcement adds by Importing Country, which opens on the countries of the statements rather than on one operator, and it runs the two EUDR checks only. Section 2 sets out both.
1. How to sign in
- Open the application.
- Keep the Environment control set to Production.
- Type your email address and your password.
- Click Connect.
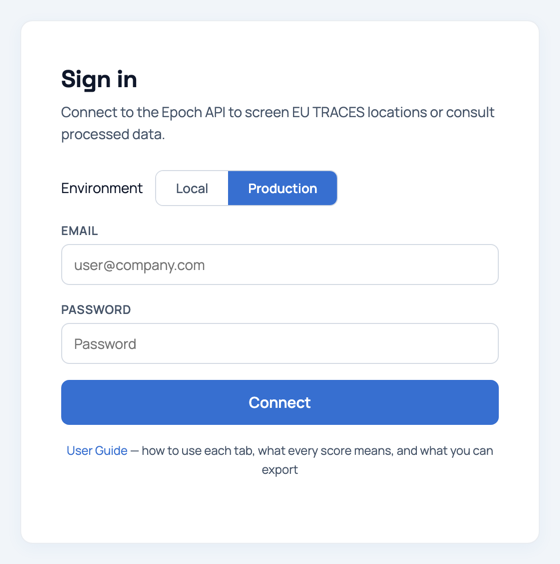
The application shows Connected at the top right. The application also shows the tab bar.
A session stays open for approximately one hour of API operation. If the API calls stop, the application shows the sign-in panel again. Sign in again. You do not lose your work.
2. The tabs of each application


Screening has three tabs. Enforcement has the same three under its own names, and a fourth that opens on the importing countries. This table gives both names, so a step written below for one application is easy to follow in the other.
| Screening | Enforcement | What the tab opens on |
|---|---|---|
| — | by Importing Country | The countries of the statements, as a dashboard. Enforcement only: it is the entry point for an authority that starts from a country rather than from one operator. |
| by Company | by Operator | One company, and the first mile supply base found for it. |
| by Supplier Location | by Producer Location | Locations that you already hold, as coordinates, a file, or an address. |
| by Plot Boundaries | by DDS Plots | Plot polygons, from a file or drawn on the map. |
| Tab | Use this tab if you have | The tab gives you |
|---|---|---|
| by Company Discover group |
A company name and a commodity. The company can be an importer, a trader, a brand, or a processor. | A map and a table of the first mile supply base, in order of priority. |
| by Supplier Location Screen group |
Coordinates, a facility file, or a site address. | The results of all the selected checks on these locations, with a map, a table, and a report. |
| by Plot Boundaries Screen group |
The polygons of the plots, as a file or as boundaries that you draw on the map. | One result for each plot, with the area, the compliance risk, and the data integrity risk. |
Within one application the tabs do the same checks. They use the same risk terms. A MEDIUM band on one tab has the same meaning as a MEDIUM band on another tab, and on the other application. Only the source of the locations is different, and the area that each check measures.
Each tab keeps its own data, its own map, and its own selection of checks. You can change to another tab during a run. You do not lose data, and a check that you remove on one tab stays selected on the others.
3. Discover, by Company
3.1 How to start a run

- Type the company name. The company can be an importer, an intermediary, a brand, or a mill operator. To make the search more accurate, add location data. For example, type
Northwind Commodities BV, palm oil, Selangor, Malaysia. - Type the commodity or the product. The application changes a finished product to its raw commodity. For example, it changes
car tyresto rubber, andchocolateto cocoa. - Type the country. This step is optional. A country makes the run faster and more accurate. If you do not give a country, the application examines all the countries of origin.
- Click Discover. A run usually takes one to three minutes. A run can take more time for a company with a small quantity of public data. The maximum time for a run is 15 minutes.
How to use a file
Click Upload your own file. The application accepts two types of file:
- A results file (
.json) from a previous run or from a partner. The application shows the data immediately. It does no calculation. - A company list (
.csvor.xlsx) with acompanycolumn. The application finds and screens each company in the list.
3.2 What the application does
A run has two steps. Read the table correctly: the two steps are different.
Step 1. Sourcing
The application gives a sourcing confidence score to each location. The score shows how sure the application is that the location is a real place. The score also shows how sure the application is that the location is in the supply chain of the company. The application does no risk check in this step.
Step 2. Screening
The application screens each location that has sufficient confidence. It does checks for legality, deforestation, water, biodiversity, natural hazard, infrastructure, and land use change emissions. It then calculates one risk band.
The application shows each result when the result becomes available. A spinner in a cell shows that the check is still in operation. A spinner does not show that the application found no data.
N/A if its check gave no data for that location. To get all the checks for one location, use the Screen tab.
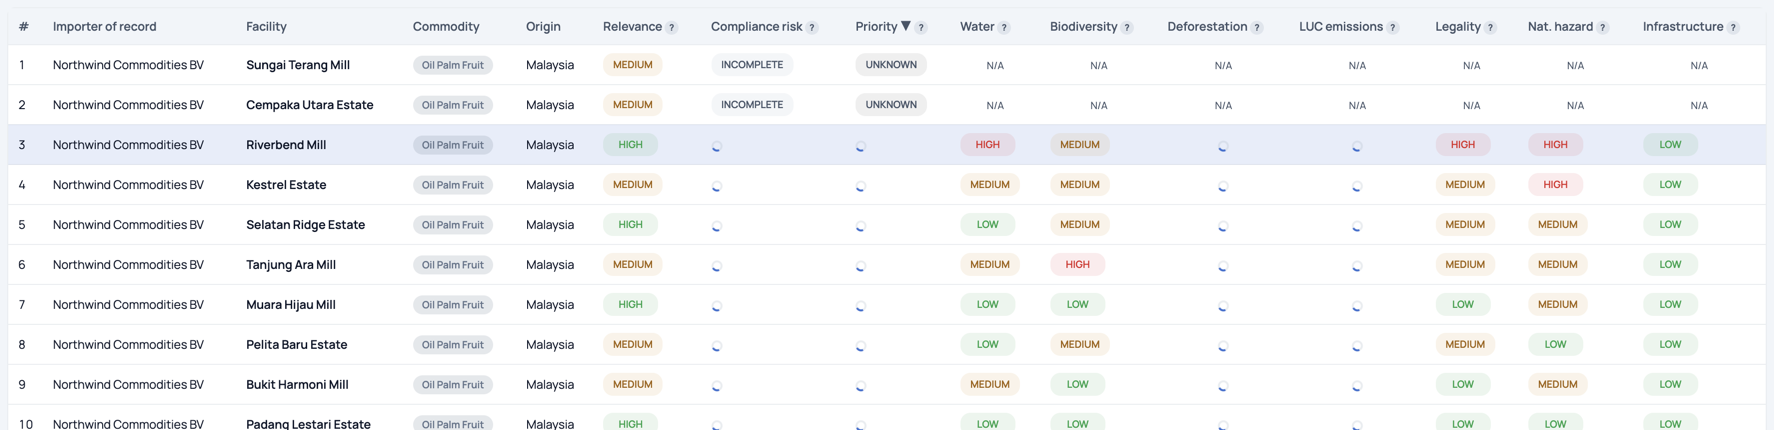
3.3 The summary data

Two chips do not show a risk result. Read them differently:
- NOT SCREENED. The location did not have sufficient confidence. The application did not screen it. The risk of this location is unknown. Do not read this chip as a low risk. To screen the location, click Screen on the row of the location.
- INCOMPLETE. The application screened the location, but it received no risk band. Screen the location again.

3.4 The table
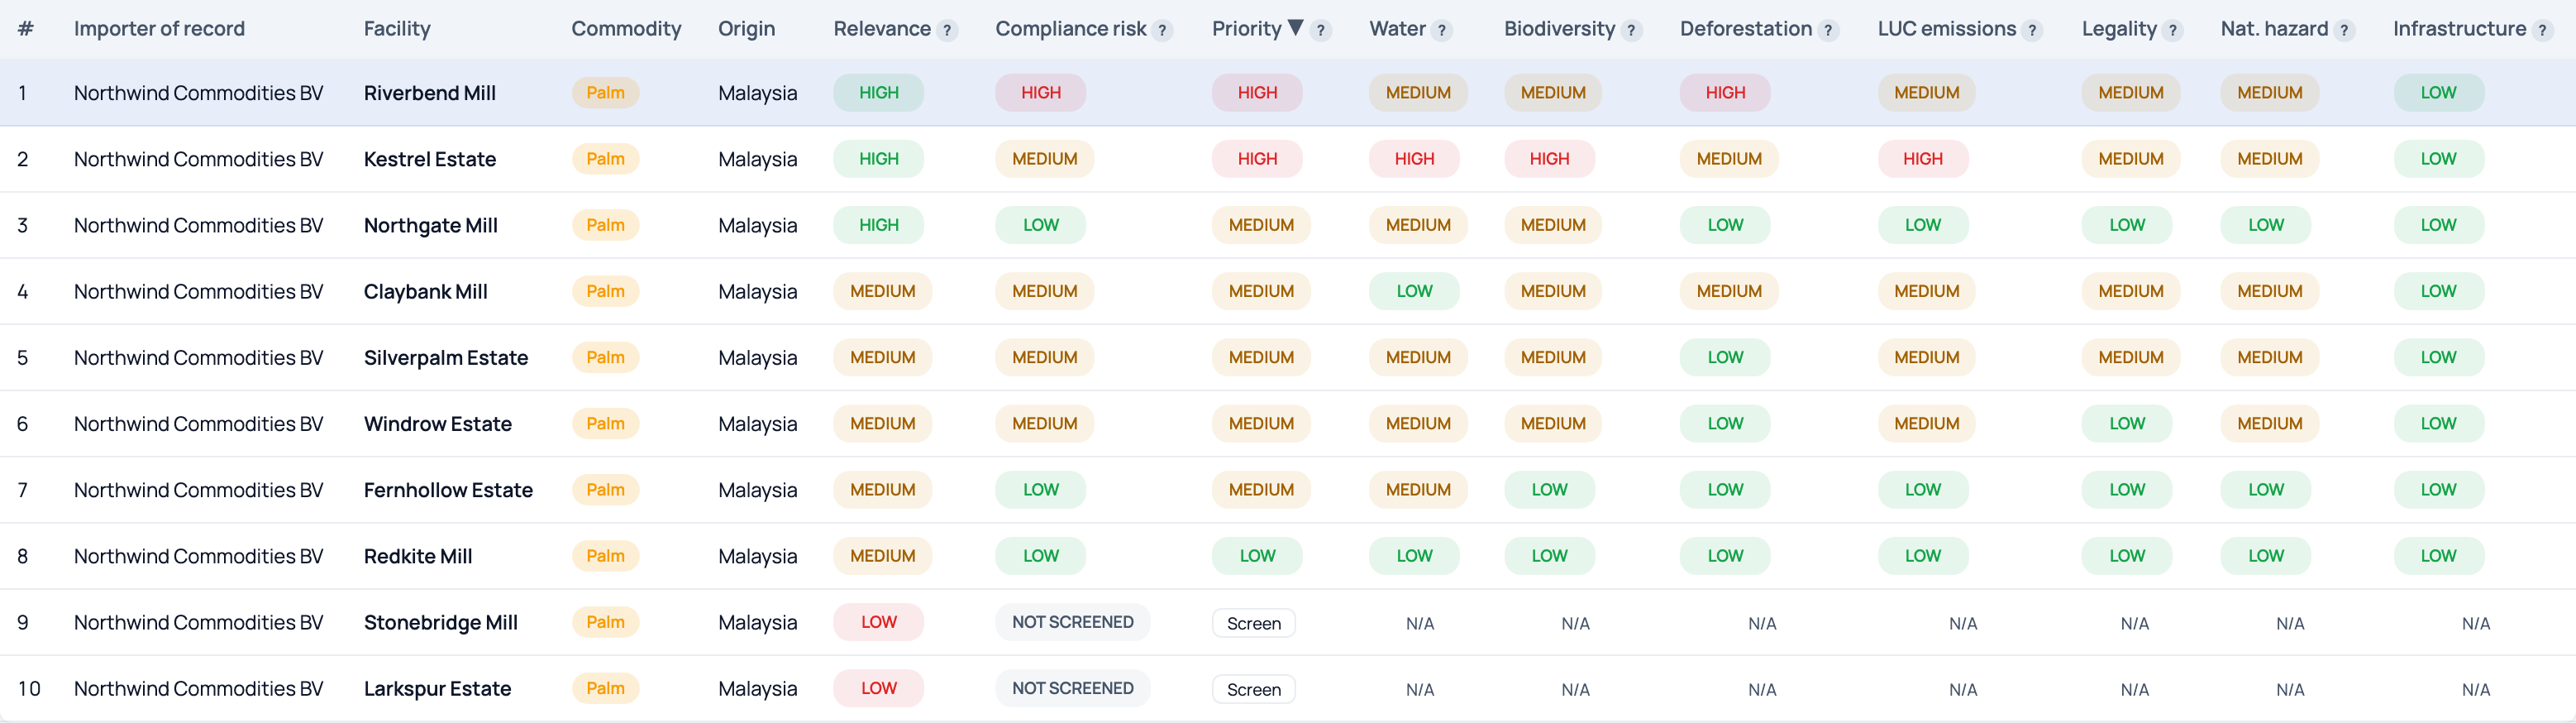
| Column | What the column shows |
|---|---|
| # | The position of the row in the current sort order. The number changes when you sort the table again. |
| Importer of record | The company whose supply chain contains this location. |
| Facility | The name of the location, from public data and trade data. |
| Commodity and Origin | The commodity of the location, and the country of production. |
| Relevance | How much attention the location needs. Relevance contains the supply chain link and the location confidence. A low value shows that the target is uncertain, or that the location is not accurate. Do not read a low value as a low risk. |
| Compliance risk | The compliance risk only. It contains EUDR Article 9 (deforestation after 2020, legality, and adverse media) and Article 10 (governance risk and country risk). It does not contain the confidence of the location. |
| Priority | The score that puts the rows in order. The application calculates it as 0.7 × Risk + 0.3 × Relevance. |
| Water to Infrastructure | Seven columns, one for each check. Refer to what each check measures. |
The condition of each cell
| The cell shows | The condition |
|---|---|
| A spinner | The check is still in operation for this row. |
| HIGH MEDIUM LOW | The check is complete. The band is the result. |
| NOT SCREENED | The application did not screen the location, because the confidence was too low. A Screen button is adjacent to the cell. |
| INCOMPLETE | The application screened the location, but it received no risk band. Screen the location again. |
N/A | The row is complete, but this check gave no data for this location. |

3.5 The map
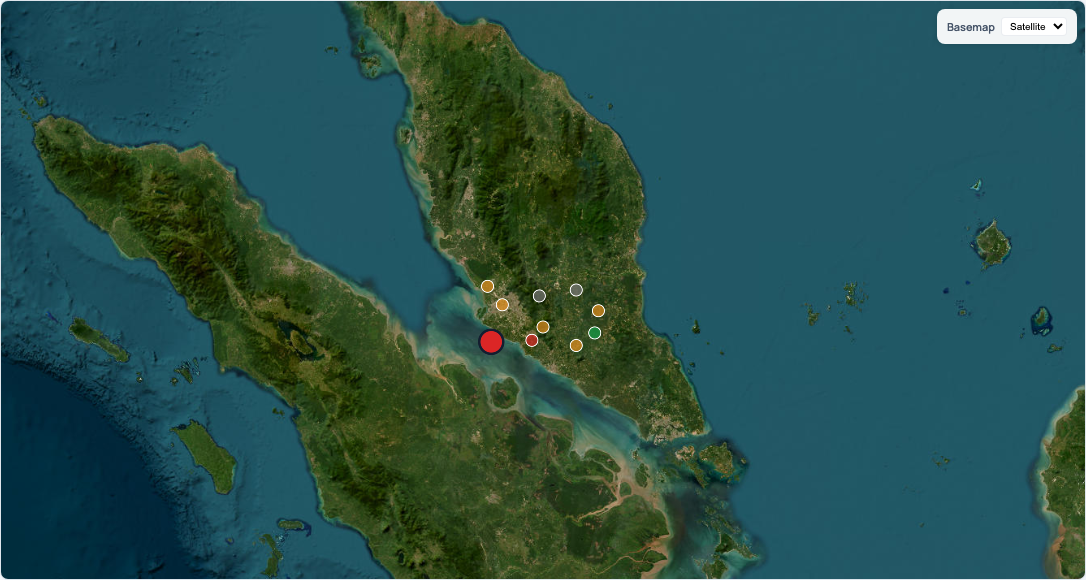
- To select a row, click its point on the map.
- To move the map to a location, click its row in the table.
- To change the map image, use the Basemap control. Select Light, Dark, or Satellite.
3.6 The detail panel
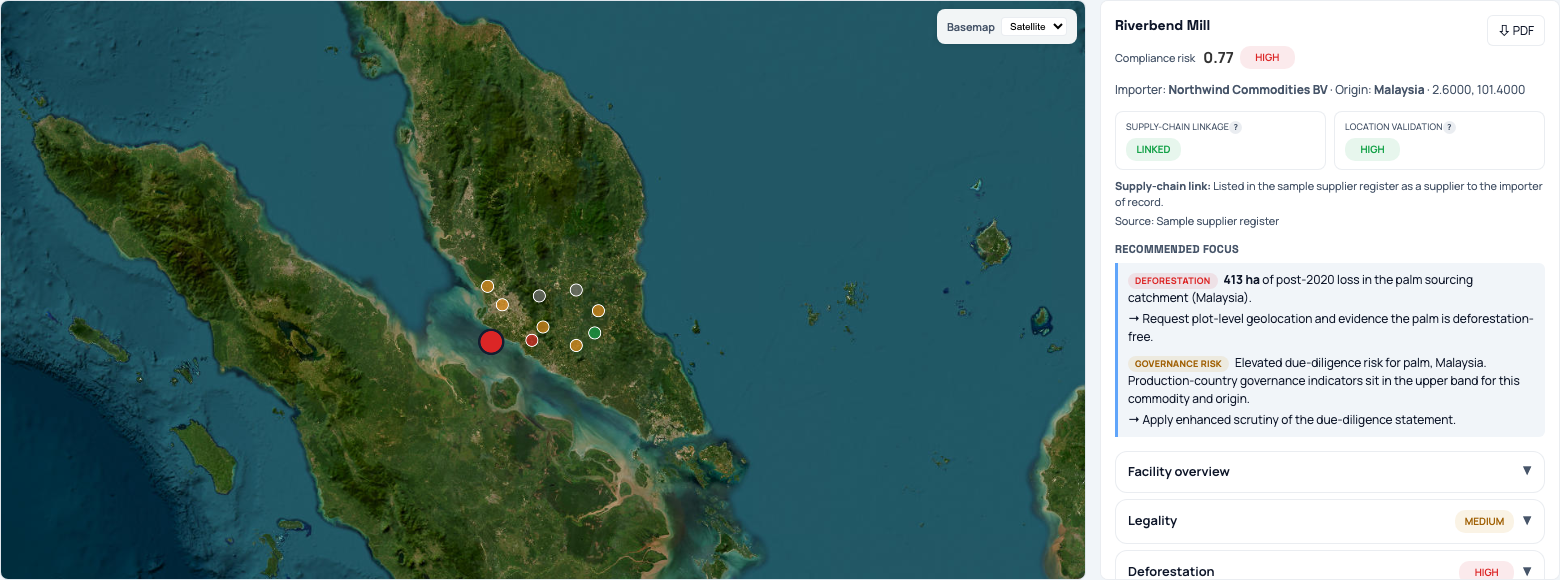
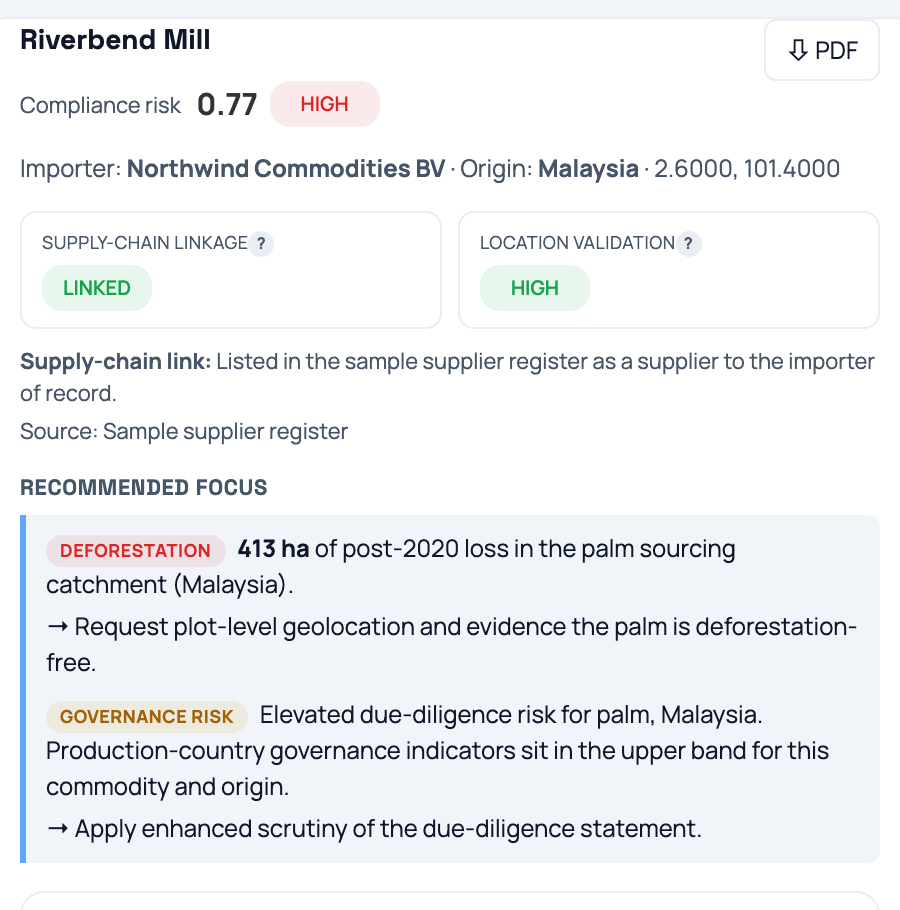
Click a row. The application shows the data of the location on the right. The top part of the panel is always visible. The groups below the top part open one at a time.
| Item | What the item shows |
|---|---|
| Compliance risk | The score and the band for this location. |
| Supply-chain linkage | LINKED shows that a source connects this location to the company directly. INFERRED shows that the location is a real facility in the sourcing area, but that no source gives the connection. This item is a category. It is not a score. |
| Location validation | The confidence that the coordinates are the real location. The application uses satellite images, buildings, points of interest, and producer data. |
| Supply-chain link | The reason for the linkage category, with its sources. A category always has a source. |
| Recommended focus | What to examine first for this location. Each item carries a tag and an action. The tags are Deforestation, Legality, Governance risk, Biodiversity, Water, Natural hazard, and Land tenure. The application puts the items in order of severity and shows the first two only. Thus this block is a start, not a full list of the findings. |
Each tag has its own condition. The condition is not the same for all the tags, so do not read the block as one limit applied to every check.
| Tag | The application shows the tag when… |
|---|---|
| Deforestation | the deforestation area is more than zero hectares. There is no band limit. |
| Legality | a legality flag gives the name of the company. A flag for the sector only does not show this tag. |
| Governance risk | the governance band is MEDIUM or HIGH. This tag does not appear when a legality flag already covers the same location. |
| Biodiversity, Water | the band is HIGH or SEVERE. A MEDIUM band does not show these tags. |
| Natural hazard | the band is MEDIUM or HIGH. |
| Land tenure | the sourcing area is over indigenous or customary land. |
The environmental tags show their own band as a word, so a MEDIUM reading reads MEDIUM.
If no tag has its condition, the block shows No dominant compliance driver, and tells you to examine the due diligence statement and the coverage of the geolocation. This is not a statement that the location has no risk.
A Caveat line can come below the items. It appears when the supply chain link is inferred and not documented, or when the location confidence is less than 0.50. Confirm these two items before you act on the block.
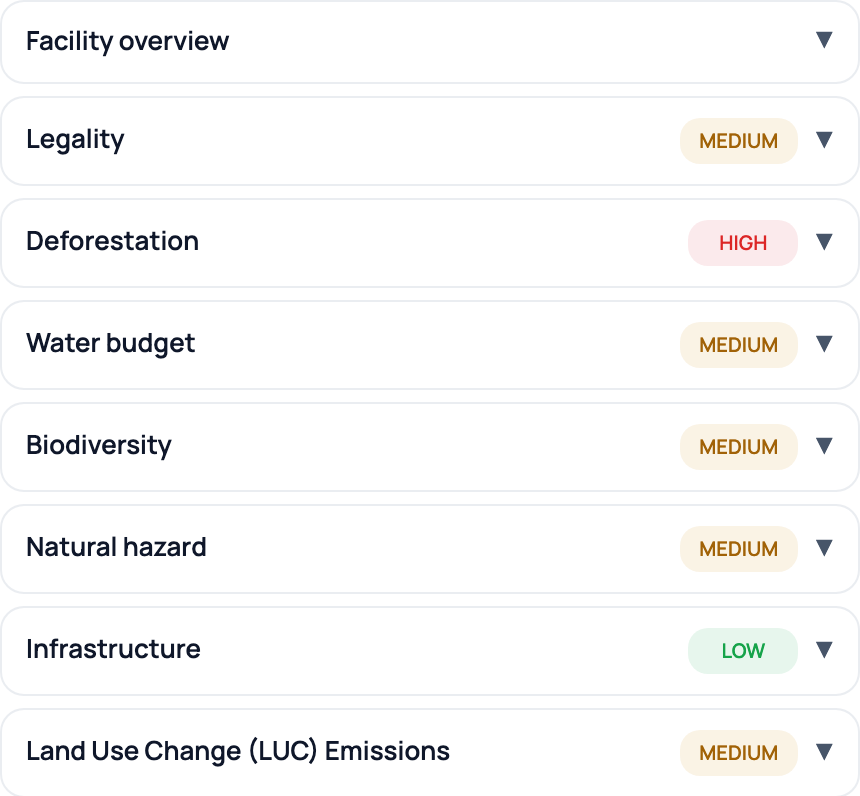
The panel has these groups: Facility overview, Legality, Deforestation, Water budget, Biodiversity, Natural hazard, Infrastructure, and Land Use Change (LUC) Emissions. The Facility overview group shows the identity of the company, the source of the location data, and the accuracy of the coordinates.
All validation fields (raw) at the bottom of the panel shows all the data fields of the location.
N/A. The check does not apply to this type of location. The application did not plan the check.
3.7 How to complete the work

- Screen all not screened (N). Click this button to screen all the locations that the application did not screen. The number shows how many locations are not screened.
- Screen. Click this button on a row to screen one location.
- Export all (PDF). Click this button to export all the screened locations to one report. The report has one group for each company.
- ⇩ PDF in the detail panel. Click this button to export only the selected location.
4. Screen, by Supplier Location
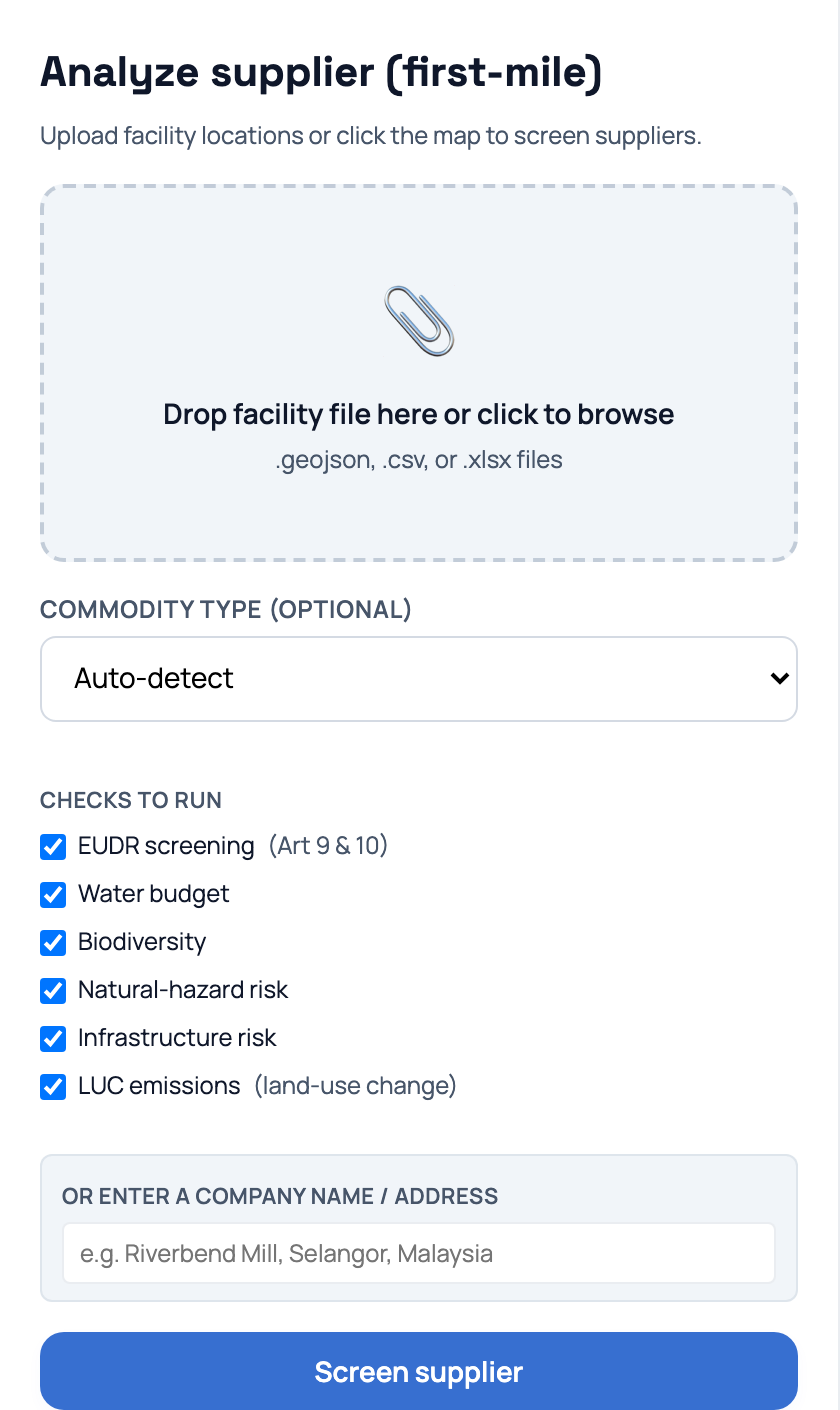
Use this tab if you know the location of the supplier. The title of the tab is Analyze supplier (first-mile). All the controls are in the panel on the left.
4.1 How to give a location
There are three methods. Use one method only.
- Put a file on the file area. The application accepts
.geojson,.csvand.xlsxfiles. The application makes the data uniform and finds the coordinates. Thus a column of addresses is sufficient. The application shows the geometry on the map immediately. - Type a company name or an address in the field below the checks. For example, type
Riverbend Mill, Selangor, Malaysia. The application finds the coordinates and screens the location in one operation. - Click the map to put a point on it. Use the 📍 Place control.
To draw a boundary instead of giving a point, use the Plot Boundaries tab. The ✏ Draw control belongs to that tab.
4.2 How to select the checks
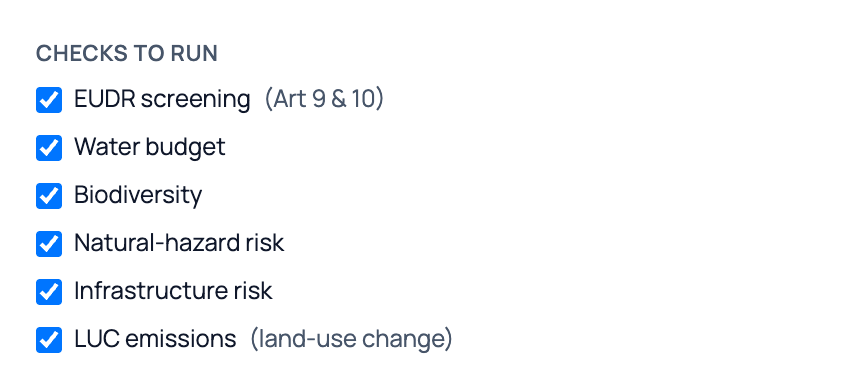
If you remove a check, the application does not do the check. This is the correct method to make a run faster.
This section is about screening. Enforcement has no check selection: it runs Article 9 and Article 10 on every run, and nothing else. If you are using enforcement, go to how to read the results.
Each tab keeps its own selection. A check that you remove here stays selected on the Plot Boundaries tab, and the reverse.
Keep EUDR screening (Art 9 & 10) selected for all compliance work. This is one control over both Articles: it runs the Article 9 legality and adverse-media check and the Article 10 deforestation and governance-risk check together. They stay two separate results, with their own scores and their own bands, and section 7 defines each one. The API still takes the two flags apart, as section 9 shows.
Set the Commodity Type control if you know the commodity. This step is optional, because the application can find the commodity. But a commodity makes the related parts of the screen more accurate.
Then click Screen supplier. The run continues in the background. You can change to another tab during the run.
4.3 How to read the results
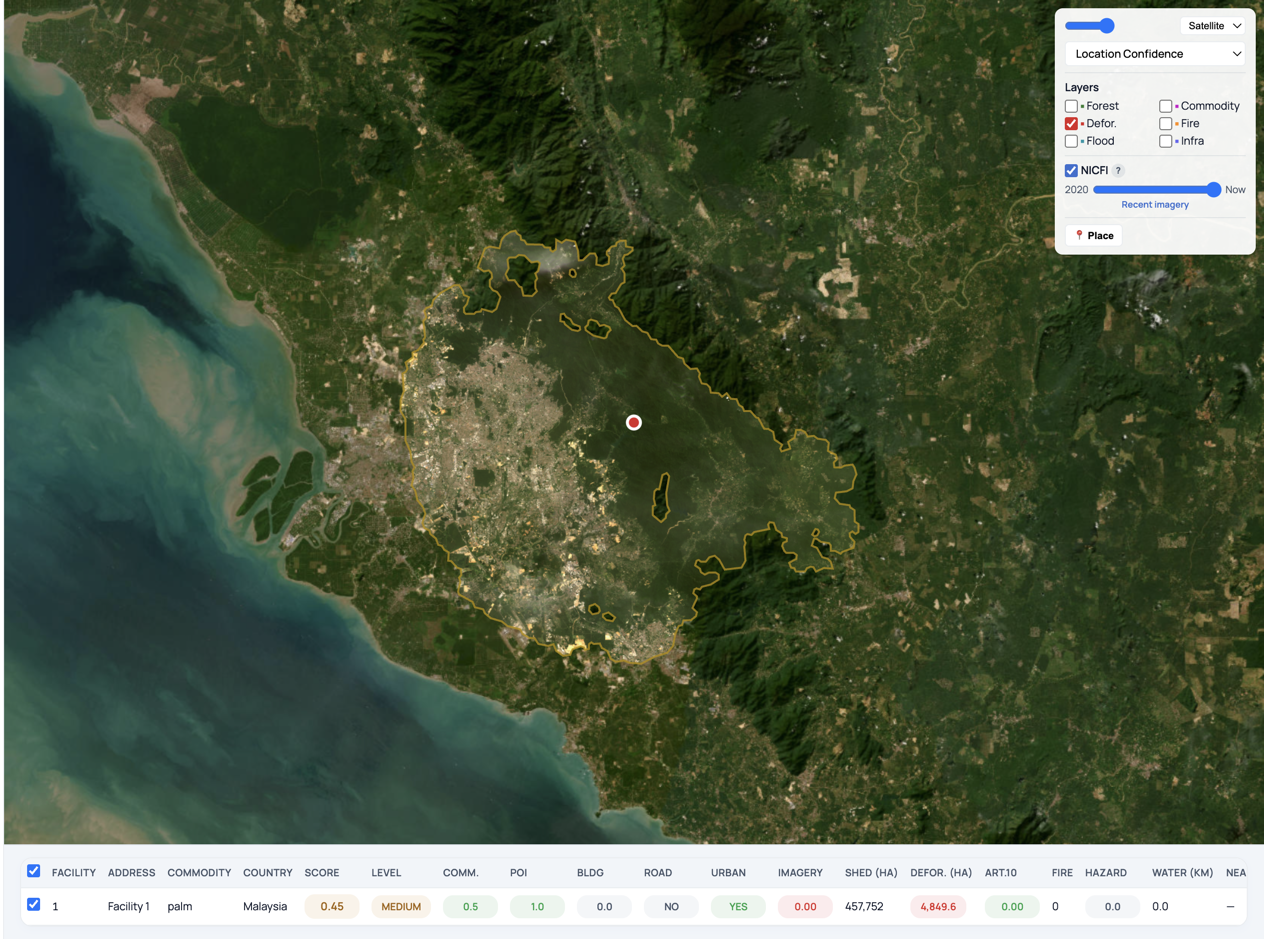
The application shows the results in three places at the same time: the panel on the left, the map, and the table below the map.
The panel on the left shows a summary of the run. It contains a company profile from public sources, the risk data for each check, and the confidence of the locations.
The map shows each location. The control panel is at the top right of the map.
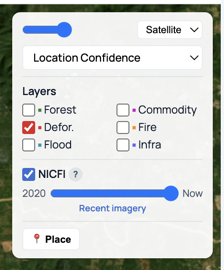
| Control | Function |
|---|---|
| Basemap | Selects the map image: Light, Dark, or Satellite. |
| Color control | Changes the color of the points. Select Location Confidence, Commodity Presence, Infrastructure Presence, Deforestation Risk, or Article 10 Risk. Use this control to find a condition that is common to many locations. |
| Layers | Puts data on the map: natural forest, commodity area, deforestation, fire, flood, and infrastructure points. |
| NICFI control | Changes the satellite image between the year 2020 and the present time. Use this control to compare the location before and after the EUDR cutoff date. |
The table shows each location with the result of each check. To sort the table, click a column heading. To move the map to a location, click its row.
The first columns identify the location. Compliance risk and Data integrity risk follow them. Read these two as separate findings: compliance risk answers whether the land has a problem, and data integrity risk answers whether the submission itself is adequate. The numeric columns after them hold the measurements that the bands are built from, such as the shed area, the deforested hectares, and the Article 10 score.
4.4 How to export
Click Export Report (PDF) at the bottom of the panel on the left, or Export Report (HTML) beside it for the same report as a self-contained file. The report contains the profile, the risk data for each check, the map, and the sources for each result.
The bar above the results table holds the data files. It has three buttons, on the right.
- Download CSV. One row for each screened location, with all the data fields of the table.
- Download GeoJSON. The same rows, with the geometry of each location.
- Download Shed. The area that the application derived for the run: the supply shed of a facility, or the watershed of a plot.
Refer to files that you can export for the contents and the names of these files. The /validate_locations operation of the API gives the same data, which is the route to use for an automated pipeline. Refer to how to use the API.
5. Screen, by Plot Boundaries
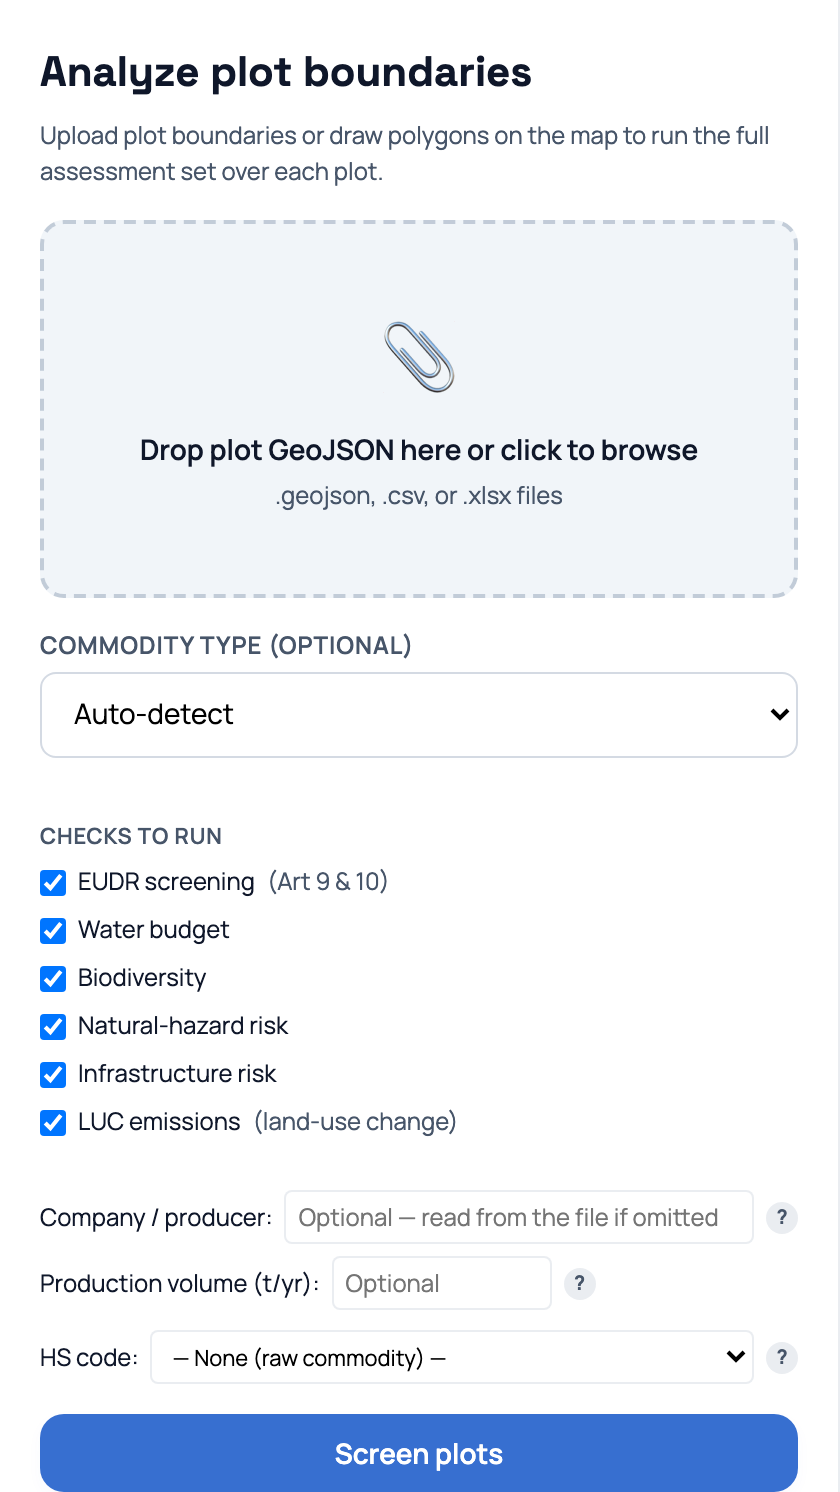
Use this tab if you hold the boundaries of the plots. The title of the tab is Analyze plot boundaries. The tab shares the panel on the left with the Supplier Location tab, so the checks are the same. Three items are different: the source of the geometry, the three fields that describe the producer, and the table of results.
5.1 How to give the plots
There are two methods.
- Put a file on the file area. Give the plots as polygons, one feature for each plot. A GeoJSON file is the direct method. The file area also accepts
.csvand.xlsxfiles. - Draw the boundaries on the map. Use the ✏ Draw control. Click each corner, then close the polygon. Draw as many plots as you need.
The application shows each plot on the map immediately. It measures the area of each plot before the run, so you can confirm that the geometry is correct before you spend a run on it.
5.2 The three fields of the producer
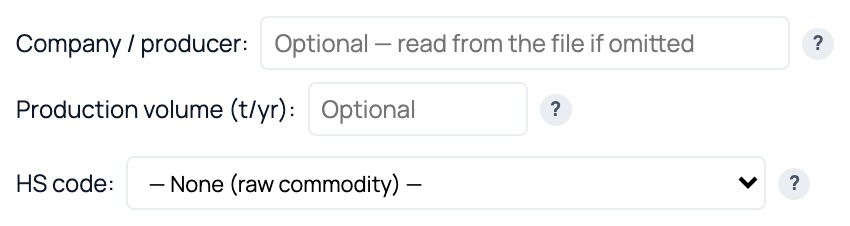
| Field | What to enter |
|---|---|
| Company / producer | The company that holds these plots. This field is optional, and it takes priority over any producer name in the file. |
| Production volume (t/yr) | The declared annual production. This field is optional. The application compares the volume against the expected yield for the total area of the plots. |
| HS code | The EUDR Annex I code of the product that you declare. This field is optional. With a code, the application changes the volume to its raw commodity equivalent before it compares the volume against the yield. |
5.3 How to read the table
The table has one row for each plot. Two of the columns are bands that answer different obligations. Do not add them together.
| Column | What the column shows |
|---|---|
| Plot ID | The identifier of the plot, from the file. |
| Area (Ha) | The area of the plot, measured from the geometry. |
| Compliance risk | Is the land compliant? This band covers EUDR Article 3. It contains the deforestation on the plot itself. |
| Data integrity risk | Is the submission adequate? This band covers EUDR Article 9. A plot with a clean geometry and confirmed deforestation gives a high compliance risk and a low data integrity risk. The reverse is also possible. |
| Shape issues | The condition of the polygon: the self-intersections, the duplicate points, and the other faults of the geometry. |
| Commodity absence | Whether the application detects the commodity on the plot. A high band shows that it does not. |
| Protected Area | The overlap of the plot with a protected area. |
| EUDR deforestation | The deforestation on the plot after 31 December 2020. |
| LUC emissions | The land use change emissions of the plot. Refer to what each check measures. |
5.4 How to export
Click Export Report (PDF), or Export Report (HTML) beside it, for the report of the run.
The Plot Boundaries tab and the Supplier Location tab share one results pane, so the same bar above the table serves both: Download CSV, Download GeoJSON and Download Shed. On a plot run, Download Shed gives the watershed. Refer to files that you can export.
6. How to read the scores
Three different questions
The three primary scores are not the same. Each score answers a different question.
| Score | The question | A low value shows |
|---|---|---|
| Relevance | Is the location real? Are the coordinates accurate? Is the location in the supply chain? | An uncertain target. Give it a low priority. A low value does not show a low risk. |
| Compliance risk | Is there an EUDR problem at this location? | The application screened the location and found no problem in the checks that it did. |
| Priority | Which location must I examine first? | No immediate work is necessary. |
The bands
Each check gives a score between 0 and 1. The application then gives one of three bands.
| Band | Score | The result |
|---|---|---|
| HIGH | 0.60 or more | Examine the location before you continue. |
| MEDIUM | 0.35 to 0.60 | Examine the location. Risk mitigation can be necessary. |
| LOW | Less than 0.35 | The application screened the location and found no problem. |
| N/A | No score | The application did not examine this item. Do not read this band as a low risk. |
| NOT BANDED | A score, but no band | The application measured the item, but it cannot band the result. The figures are correct and you can read them. Only the band is withheld. Do not read this band as a low risk. |
You see NOT BANDED on the LUC emissions card of a run that has no commodity scope. The emissions are real, but a sourcer cannot be banded on land use changes that are not theirs, so the application gives the figures and withholds the verdict.
Three items use a lower limit: their MEDIUM band starts at 0.30, not 0.35. They are the Infrastructure check, the Natural hazard check, and the Overall Risk that the application calculates from all the checks together. One report engine serves both applications, so this limit applies in the screening application and in the enforcement application.
The legality band
The most specific source gives the legality band. The application does not add the sources together.
| The most specific source | Band |
|---|---|
| A source that gives the name of the company or the facility | HIGH |
| A source for the same district, municipality, province, or state | MEDIUM |
| Three or more sources for the country, and no more specific source | MEDIUM |
| Less than three sources for the country, or no source | LOW |
If the application finds no adverse data, the band is LOW. This is a correct result. The application does not show N/A in this condition. The application puts the sources in order of specificity, then in order of date.
7. What each check measures
These are the seven checks. The columns of the table and the groups of the detail panel use them. The definitions are the same on every tab. Only the area that each check measures changes: a plot measures its own area, and a supplier location measures its sourcing area.
Screening runs all seven. Enforcement runs the first two only — Legality and Deforestation, the two EUDR Articles — so the other five have no section there at all. An absent section means the check was never run.
| Check | What the check measures |
|---|---|
| Legality EUDR Article 9 |
The applicable laws of the country of production, as given in Article 2(40). The check also does an adverse media search for the company. |
| Deforestation | The deforestation in the sourcing area after the year 2020, in hectares. The check uses Hansen/GFC data and JRC TMF data. It measures the natural forest as it was on 31 December 2020. The check includes all causes of deforestation. It does not attribute the deforestation to the commodity. Governance risk and country risk have a different score. |
| Water budget | The water stress in the sourcing area. The check uses the climatic water deficit and the water budget. A HIGH band shows an area with insufficient water. |
| Biodiversity | The condition of the landscape. The check uses the fraction of natural cover, the structure of the habitat, and the distance to protected areas and to intact forest. |
| Natural hazard | The exposure of the location to natural hazards. The check uses fire data (FIRMS), flood areas, flood events, precipitation data, and extreme heat data. The Water budget check measures the water stress. |
| Infrastructure | The infrastructure near the location. The check uses the quantity and the density of the buildings, the road access, the water access, the distance to ports, the distance to the power grid, and the points of interest. |
| LUC emissions | The emissions from land use change. The headline figure is the intensity: the annual CO2e for each hectare, written as tCO2e/ha/yr. Read the intensity first, because it compares runs of different sizes directly. The absolute total is beside it. Do not divide the total by the converted area: the total includes the oxidation of peat and the N2O from fertiliser, and both scale with the whole area rather than the converted part. The check measures the change of natural cover over the LSRS amortisation period, with the linear discount method of the GHG Protocol LSRS. That period is not the EUDR cutoff of the year 2020, and it is 25 years on cocoa runs rather than the 20 that the LSRS default suggests. The band is provisional. The quantity of emissions and the intensity are correct. On screening, the exported report also restates the emissions for each unit of product, in kgCO2e/kg, for whoever assembles a product carbon footprint downstream. Conversion and land management keep separate rows there, because they are separate inventory categories under the GHG Protocol LSRS and adding them would report the fertiliser N2O as land use change. The label states the basis: a declared production volume, or an estimate from a reference yield when you gave no volume. |
For the full method of the deforestation check, refer to docs.epoch-sco2-api.com.
8. Files that you can export
8.1 The screening report (PDF or HTML)
You can get this report in four places:
- Export Report (PDF) on the Supplier Location tab, for the full run.
- Export Report (PDF) on the Plot Boundaries tab, for the run over the plots.
- ⇩ PDF in the detail panel of the Discover tab, for one location.
- Export all (PDF) on the Discover tab, for all the locations of a run. The report has one group for each company.
The report contains the profile, the risk data for each check, the map, and the sources for each result. The three tabs use one report engine, so the same run gives the same figures and the same wording in every export.
Export Report (HTML) sits beside the PDF button on both Screen tabs. It gives the same report as one self-contained HTML file, with the styles and the maps embedded, so it opens without a network connection and its text stays searchable. Use it when you need to search the report, or to keep it as a record that does not depend on a print dialog.
8.2 The screening results (CSV and GeoJSON)
The bar above the results table gives these files. The Supplier Location and Plot Boundaries tabs share one results pane, so the same bar serves both.
| Button | Name of the file | Contents |
|---|---|---|
| Download CSV | screening-facilities-{date}.csv, or screening-plots-{date}.csv | The same data as the table, one row for each location. |
| Download GeoJSON | screening-facilities-{date}.geojson, or screening-plots-{date}.geojson | The same rows, with the geometry of each location. |
| Download Shed | shed-{date}.geojson | One feature: the supply shed of a facility run, or the watershed of a plot run. |
The application writes facilities or plots in the name of the file for the type of location that you sent. {date} is the day of the export, as YYYY-MM-DD.
Each feature of the GeoJSON contains the geometry and all the data fields: the confidence, the score and the band of each check, the deforestation area, the legality sources, and the other fields. The same data is also available from the /validate_locations operation, which is the route to use for an automated pipeline. Refer to section 9.
8.3 The plot file (GeoJSON)
You can get this file from the data of a plot. The name of the file is {clientid}_{supplierid}_{partid}_{ingestion_date}_{status}.geojson.
| Field | Contents |
|---|---|
uuid and plotid | The identifier of the plot, and the plot identifier of the initial file. |
area_ha_commodity | The area of the plot, in hectares. |
noncompliance_area | The deforestation area in natural forest, in hectares. |
noncompliance_area_perc | The deforestation as a percentage, for natural forest only. |
deforestation_confidence | The confidence of the detection. |
deforestation_alert | The classification of the alert: critical, or none. |
deforestation_start and deforestation_end | The first date and the last date of the deforestation. The value is null if there is no deforestation. |
monitoring_start and monitoring_end | The first date and the last date of the monitor period. |
thumbnail_url | The address of the satellite image of the plot. |
8.4 The audit trail (ZIP)
You can get this file from the /export_eudr_dds/ operation, giving it the collection that you want the statement for. Refer to section 9. The name of the file is eudr_dds_{collection}_{ingestion_date}_{status}.zip.
| File | Contents |
|---|---|
audit_trail_{hash}.pdf | The full audit trail: the compliance summary, the maps of the country and the plots, the document data, the information requirements, the risk assessment, and the data of each plot that is not compliant. |
dds_geolocations_{hash}.geojson | A small GeoJSON file for the EU TRACES system. |
The TRACES file contains the geometry and four fields only: ProducerName, ProducerCountry, ProductionPlace, and Area. Thus the file stays below the TRACES limit of 25 MB.
9. How to use the API
The Epoch API does all the operations of the application. Thus you can use the API in your own system. The application uses four operations.
| Operation | Function |
|---|---|
POST /refresh_token | Gives a token for your credentials. Send the token in the Authorization: Bearer <token> header of all the other operations. |
POST /source_locations | Finds the first mile locations of a company. Send company_name, product, relationship=first-mile, and the optional country. The operation gives status 202 and a task identifier. Examine /source_locations/{id}/status. Then get the results from /source_locations/{id}/results. |
POST /validate_locations | Screens the locations. Send the locations, and select each check: include_art9, include_art10, include_water_budget, include_landscape_integrity, include_hazard, include_infrastructure, and include_luc_emissions. For plots, send the optional company_name to give the producer of the plots. This value takes priority over the properties of the file. This operation is also asynchronous. |
GET /export_eudr_dds/ | Gives the audit trail of a screened collection as a ZIP file. Send collections with the collection that you want the statement for. Section 8.4 lists what the ZIP contains. |
For all the operations, the data structures, and the methods, refer to docs.epoch-sco2-api.com.